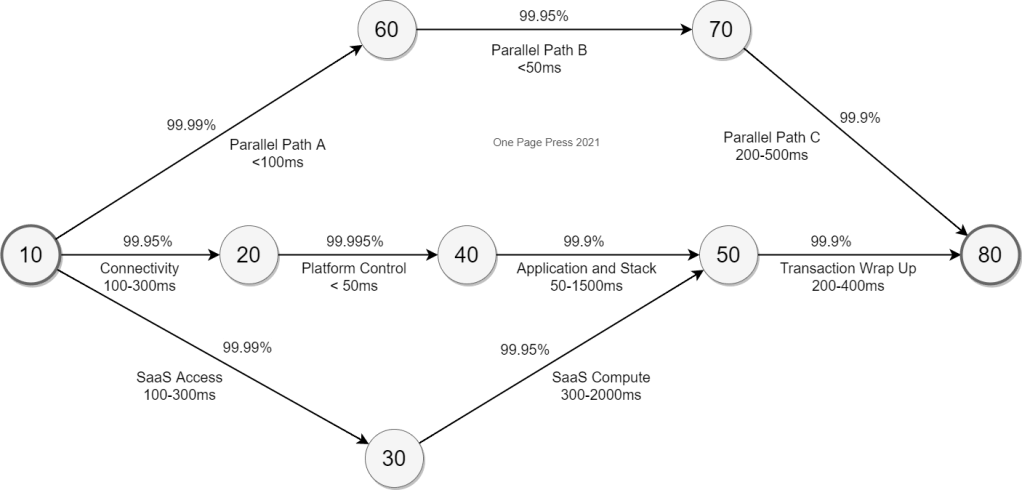
Uptime is usually measured with availability and performance. Availability is total time minus down time, indicated by a total percentage point. This is where we use 2 9s (99%), 4 9s (99.99%) and 6 9s (99.9999%) to label our service level agreement. Performance is usually related to latency. indicated by response time of one leg of data flow. In my example here, 10 to 80 is a round trip from a browser request to a browser response with a high coarse grained data flow.
End to end digital transaction with uptime and latency mapping
This is a conceptual diagram that more details should be furnished. It is not specific to host environment, technologies, or nature of your application. Please note, a lot of our system transaction requires a “wrap up” portion, either hosted in the same system, or be supported by other interfaces. This is where an external system received update, a notification is sent, some triggers are fired to get cascading update that is essential to consider the entire transaction complete. Those are not necessarily a browser experience or user experience, but essential to the overall flow, as integrity is just as important as confidentiality and availability, the three pillars of FISMA mandate.
SaaS route is an example that your business transaction goes external way. And parallel path can interpreted in a few ways, it could mean your future architecture, a replacement of your existing flow; or it could mean zero trust protection surfaces and its over-shadowing impact. It is end to end, and it could and will add additional impact to both uptime and latency.
I highly recommend a thorough study for all your high value asset systems. It will depicts your weakness, your opportunities, your integration challenges and any impact coming to you with any future change you are contemplating.
And, it also build the right expectation of service level agreement you need with your clients.
Zero trust (ZT) is now a top subject in information technology. We observed similar landscape changing technology initiatives before, personal computer (PC), web and web2.0, service oriented architecture (SOA), wireless network, mobile device, cloud computing, and many more. Understanding zero trust and preparing your organization for it is an imperative step. It is the first link in the chain of success.
Zero Trust Adoption Map
If you visit the internet, every big player has a distinct page on ZT. Many of them are part of the solution circles, and offer product and services, usually seen next to their explanation of this subject. I randomly picked and listed a few of them, and please feel free to explore and compare the interpretations and focuses from various industry leaders.
My diagram suggests you go directly to the source. Zero trust architecture, in NIST SP 800-207 is final since August 2020. NIST publishes standard and principles on technologies. SP stands for special publication, and 800 refers to computer security. You also see examples of past and draft subjects such as Secure Web Services (SP 800-95) and Micro Services Architecture, Containers and VMs (SP 800-180). A good grasp on SP 800-207 should serve your well when adopting ZT.
In my point of view, zero trust is a state, a state of secured computing. It is not one architecture, not a single solution, not a onetime problem solving (Y2K etc.), not a painless panacea someone promised you. Rather, it is a multi-layered, cross-discipline, and orchestrated architecture shift with major retooling based on a set of well-defined security objectives and principles. Along with the technology change, it also involves people, culture, and process adaptation since the new state means the new norm. It is a state because, at end of the day, you are either no zero trust (you may have valid business reasons), complete in zero trust, 15% overall in zero trust, or 95% critical asset in zero trust. Zero trust is also a shared journey that you, and your ZT partners (solution providers), to continue mature, advance, and adapt in the ever changing world of computing.
This Salesforce.com article summarizes the benefits of cloud computing. I am in full agreement of the 12 business advantages. Serverless performs extremely well in some specific areas such as cost saving, flexibility, mobility, less maintenance and competitive edge. Moreover, it is where the claim of “let your team now focus more on business value and solution development and less on infrastructure.” comes to fruition.
From my viewpoint, serverless also helps de-componentize legacy systems and provide significant value for process re-engineering. Be watchful on two things: First, avoid to retrofit your monolithic compute and parity it up with this new architecture. Second, do the least amount of copy/paste code reuse. Serverless is not designed for migration and lift over, but present an opportunity of releasing the next generation digital solutions to support an enhanced business process.
Uptime objective is part of a service level agreement (SLA), which defines the terms and performance metrics by a service provider. SLA covers a long list of system characteristics, where uptime is usually the central figure.
Computing is more and more distributed these days. It evolves from monolithic in a physical data center to virtual, to cloud, and to edge. Uptime of a typical system today has five main components. Please also see a more technically drawn in my earlier post: A hybrid cloud architecture
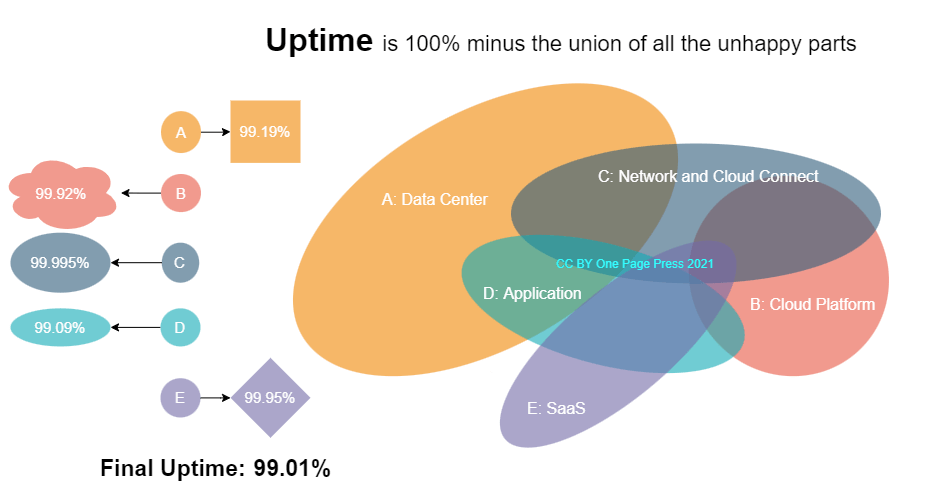
Uptime is: 100% minus union of all incident time, seen from this picture.
Example of an uptime chart
A: Data Center – This is where power outage, flood threat, cooling problem, uncommon human events can come into play. Typical outage from operation are hardware and cable failures, storage and hypervisor problems, virtual and physical machine breakdowns.
B: Network – Network is usually the highest uptime holder in the entire chain. It covers transport services, private link among data centers and corporate offices, and cloud connect. VPN is also part of this service.
C: Cloud platform – This is public cloud, gov cloud, or private cloud. It is composed of cloud services that a provider (AWS, Azure, GCP for example) offers to run your workload, and associated infrastructure. Cloud infrastructure covers hybrid connectivity, organizations and users, accesses, service control and guardrails.
D: Application – This is the biggest wildcard among all. Application can be on premises, in the cloud, or both. Since application is on the top of OSI layer (please check out my earlier post), I has the most variance than any other parts. Bugs, test failures, data quality issues, missing dependencies, lack of coordination, all could lead to a break and fix. Any undetected defects in the security area is usually the worst nightmare of all. Modern day continuous integration continuous delivery (CICD) platform and micro service architecture promote agility of change and improve the application uptime via faster turnaround. However, in my opinion, the best recipe is quality, usually boosted by team, culture, discipline, process, and effective assurance.
E: Software as a service (SaaS) – This is where you choose buy over build. SaaS can be your entire solution, or part of it. SaaS can runs critical workload for your organization, or provide a desired feature. From authentication and authorization, identity management, fee collection, to an AI plug in. SaaS is everywhere.
My main point and example is the actual uptime of a business is total available time (100%) minus the union of all the unhappy parts. It is not an intersection. Unfortunately, outages do not have a rendezvous, to help you reduce the overall downtime.
Therefore, consider followings to increase your overall uptime:
Network service and network engineering are your top priorities. Digital transaction is data packet moving from one end point to the other. Network is your highway, private way, and shortcuts to the destination.
SaaS first. Usually SaaS bears much higher SLA than self-build systems. SaaS allows you to pass the SLA requirement to the provider.
Cloud first. Infrastructure as service (IaaS), platform as a service (PaaS), function as a service (FaaS). Cloud infrastructure performs better than data center.
Data center modernization. Use software defined and hyper converged infrastructure (HCI) to transform your data center operation. Automation is vital, and start looking at AIOps.
Application. People consider uptime as an infrastructure challenge. In reality, the most contributing factor is application. At design time, software architecture dictates the underlying infrastructure, a wrong choice is very hard to be mitigated in operation. At run time, early detection, fast rollout (CICD), open technologies, automation and collaboration can help.
Other transformational ideas. Consider application less, by solving your business problem without an application. Consider artificial intelligence operation, so operation and recovery with less human intervention. Consider least hop and local compute when the use case applies, the more a system depends, the more likely it breaks. That is the whole point of my post: union of all unhappiness.
Leo Tolstoy’s famously said: Happy families are all alike, every unhappy family is unhappy in its own way.
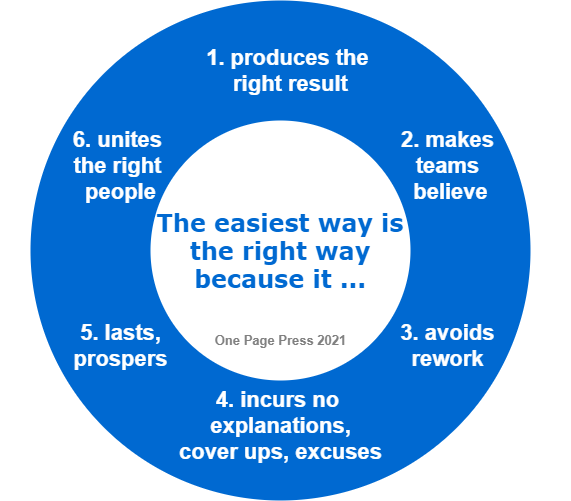
Uptime is a job to connect a chain of families with maximum happiness. You may also get some insight from my post of: The power of the right way
We often see the most effective person handles his/her busy work load in an easy way. The secret is simple, the easiest way is the right way. Here are some reasons people often overlook:
The right way is linearly proportional to the correct result. It delivers.
The most powerful way to rally the team is make everyone believe. The right way is not biased, not personal, not vague, not hidden. It connects.
For any partial result, no result, or result too expensive to sustain, a fix or redo has to be followed. Right way avoids this. It completes.
The well delivered work does not require further explanation, excuses, or cover ups. It moves on.
The right way is not sensitive to time, or even technology advancement. We see solutions from hundreds year ago and stand strong. It lasts.
Might not have the majority agreeing or supporting to start, the right way has the magic to gradually drive people in. Preserve. It prevails.
It takes vision, courage, strength, and perseverance to do so.
Organization maintains a technology stack. It is a list of technologies, anything from IDE, runtime, COTS/SaaS, to cloud service providers. The same organization also has an approved methodology, agile and DevSecOps in modern days. You could see long spreadsheets and wordy documents.
In this One Page Press concept, I mesh the two together, so within 60 seconds, you have a grip on how we conduct business via what major brands.
The picture emphasize the iterative approach that agile promotes. I will have my future blog article talking about A-Z and 0-9 to zoom in this big circle. The illustration does not aim to be complete and many your favorite logo might be missing.
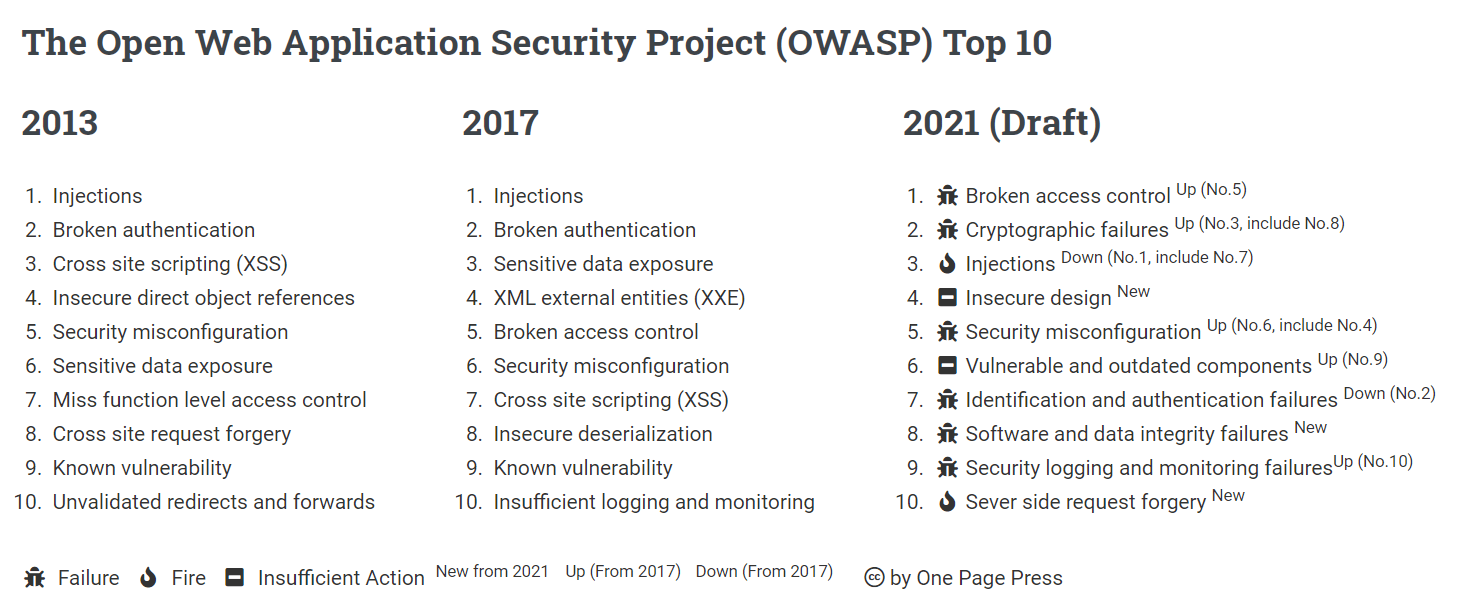
The open web application security project (OWASP) top 10 2021 is now in draft for peer review. OWASP is an online community that provides articles, best practices, tools, and communications, it is a nonprofit foundation you should follow. I recreated a one pager of 2021 top 10 side by side with the list from 2017 and 2013, where you can see the category movement.
OWASP Top 10 2021 Draft. 2017 is the current official list.
I add an additional icon to each category. A bug icon indicates a state of failure; a fire icon indicates an attack; and a minus icon to indicates insufficient action. Here is more explanation:
Failure: a scenario of “I forget to lock my door and I forget to check, monitor, or alarm”. It is a state, and can go unnoticed or even unharmed until someone breaks in, also known as incident.
Fire: a scenario of “My lock is not strong enough” when someone attacks. This requires a purpose action from outside to start. Please note there is a constant racing between locksmiths and lock breakers. This is an area that you might do sufficient but your attacked get ahead of the game.
Insufficient action: a scenario of “I never upgrade my locks or I put the wrong lock”. It is a root cause, it leads to the state of failure.
From 2017 to 2021: XXS is now part of injections. XXE is part of security misconfiguration. Insecure deserialization is now part of cryptographsic failure.
OWASP
You can find plenty of OWASP video on YouTube. It is a good starting place to learn the basics. In my blog, I will comment on a few items I feel strongly.
New category – Insecure design: In my career, I have been an advocate to move security from right to left, and from operation reactiveness to proactive design, development, and testing. My current design norm requires security architect be the core of the herds (along with software and infrastructure architects). They are not three architects in different disciplines, but three full stack architects with assigned focuses and accountabilities. So they can fully collaborate. In addition, in my personal view, this is still not left enough. Security needs to be all the way to the start: requirement. We should build security in as a mandatory and essential feature of every product or service. If you don’t have the requirement, you can’t design for it. You don’t have a design, you cannot start developing.
New category – Server side request forgery: OWASP stated this is a relatively low incidence rate with above average testing coverage, along with above average ratings for exploit and impact potential. This new category is a perfect example of OWASP listening to the industry and adding emerging problems that is powered by advanced techniques.
Cryptographic failures: Previously known as sensitive data exposure. Organization can have this problem unnoticed, sometime unhurt. This category comes from anywhere of a bad design, a rushed release, someone’s neglecting, corner cutting, work fatigue, or process deviation. Consider encryption the last line of defense . There are usually multiple control failures lead to data exposure. When it did happen, meaning all other things fail and your data ends with the wrong party, at least it is not readable. What I mean is do not work on encryption alone, but do work diligently to the max degree.
Know vulnerabilities: People tend to ignore technical debts, which include known vulnerabilities. Know vulnerabilities are not a self-exploding bombs, but they are flammables, weakened links, worn pipes, thus making your systems easy targets. They could be the center of next disaster when bad actors and a situation having a rendezvous. It is not as obvious as a bug, a misconfiguration, or an operation failure. Most time, it feels just like another day. I created a special minus icon for that reason, call for actions. Don’t let technical debts bankrupt an organization.
A few trending down ones: Bad actors do not give anyone a break. Injections, broken authentication are moving down the list not because we live in a less action world, but there are better tools and solutions in place to detect and fend off those issues. From software as a service, platform as a service, to modern framework, rigorous reviews and testing, plus wider deeper understanding of those problems, development team are taking care of the business. It is also an indicator OWASP is effective and contributing to the society as alarming the community year after year, and the industry is making progress on the resolution.
From system migration to service adoption, cloud progress is about excellence on both business applications and maturity of infrastructure. A balanced approach promotes a healthy growth of the community, and ensure consistent value delivery and lasting benefits to the organization.
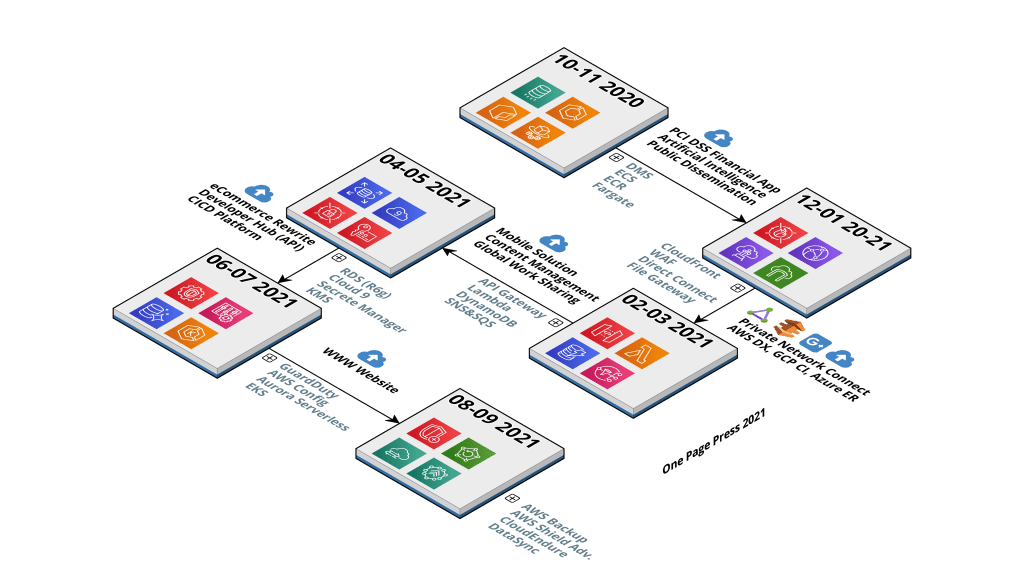
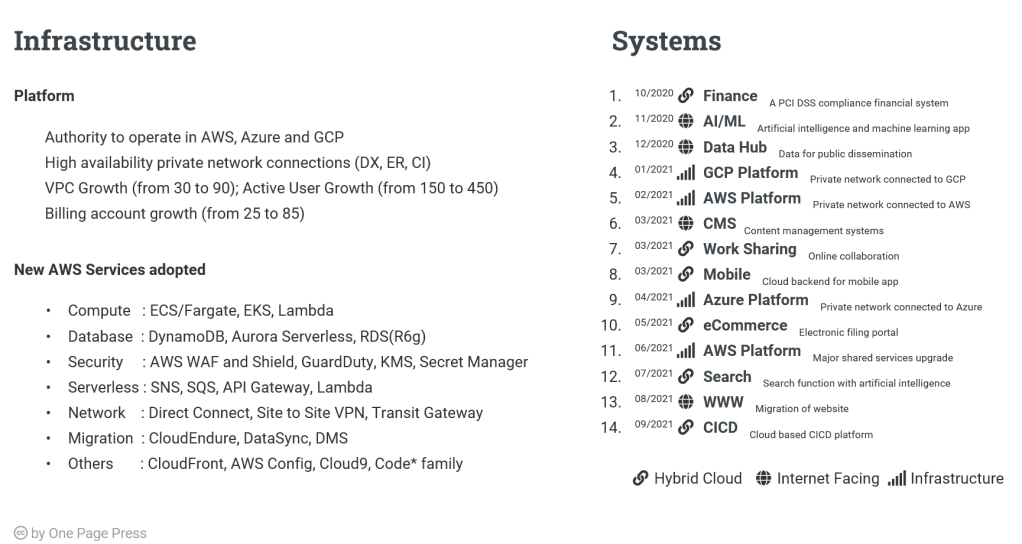
This is an example of a cloud roadmap, or a score card of the past performance year. The blue cloud icons with a up arrow signals a list of successful cloud computing systems, either via migration or native development. The plus icon is next to a list of cloud services (AWS) being adopted. You can see the same list of services with their official mark on the calendar tab. I used a fiscal year timeline, which is from October to September of the following year. Instead of showing you a plain spreadsheet, or a lengthy presentation, this is visually pleasant and information compact.
2021 Cloud Roadmap
One can create roadmaps in a variety of ways. As the first signature post One Page Press presents, I build a slideshow below to demonstrate along with two other views (summary, time table, and graphics) where the exact same information is displayed.
Summary style: focus on subjects, numbers, categorization, and calling out key accomplishments.
Time table style: focus on chronological order of events, with same format of each block, and should be the default view.
Graphic style: colors, flows, inserts, 3D touch, and much more. In this example, I intentionally omitted summary to leave the picture less busy.
Which flavor do you like? Please like, comment, share and follow. You can email me for other great ideas and thoughts.
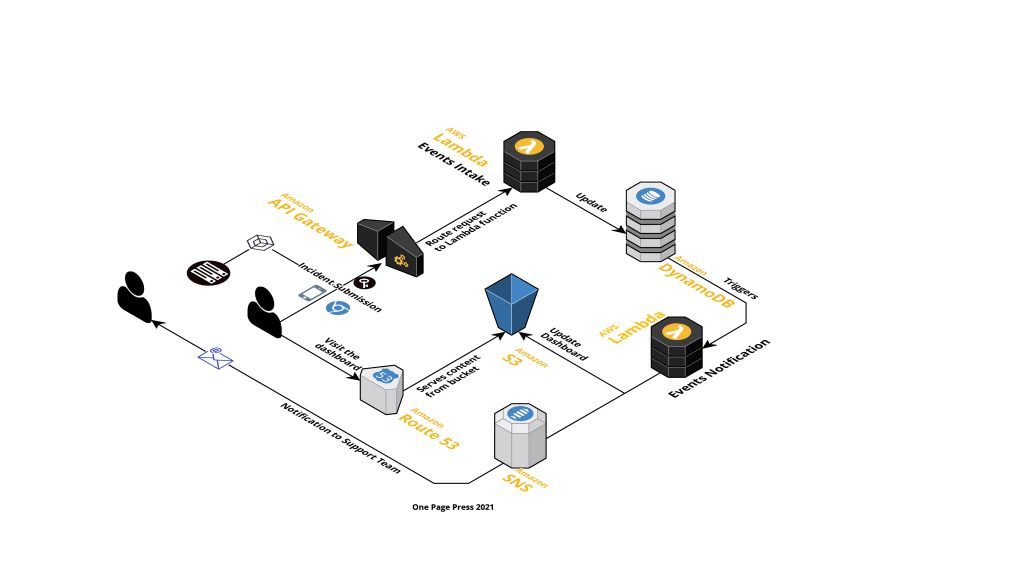
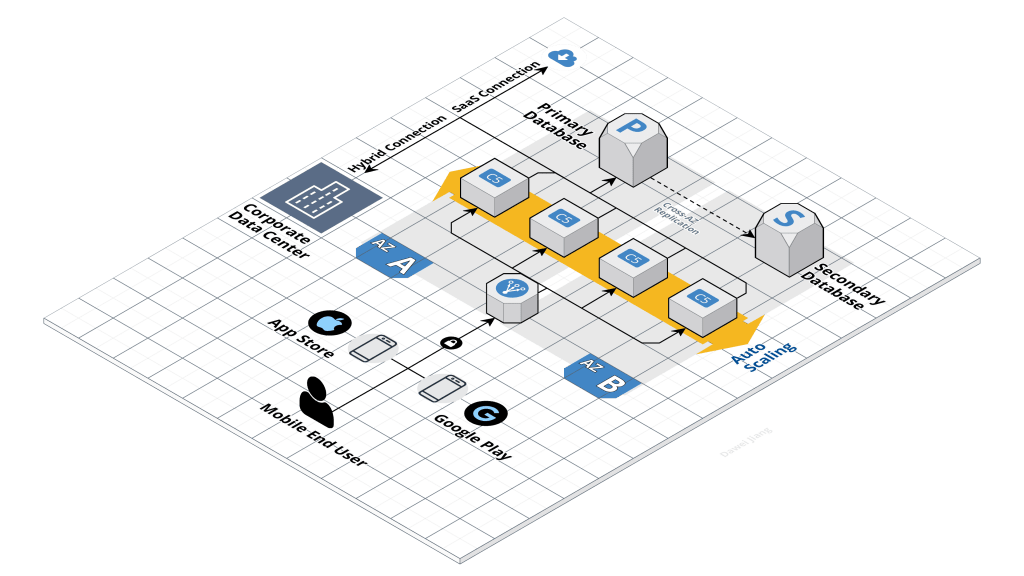
Example of a mobile application powered by a hybrid cloud backend.
Mobile application with a hybrid cloud backend
This is a first generation cloud system. It connects and serves using a simple stack. The mobile application was offered on both iOS and Android platform. This diagram illustrates the aerial view of all the development pieces.
This is a middle design artifact where the visual graduates from high level conceptual drawing, which is usually a handful of boxes and lines. This artifact includes enough details about boundary, connection, compute, storage, and ingress/egress. It is not the final specification where additional details including sizing, ports, integrated systems, and zones are detailed out.
Middle design artifact is what best connects stakeholders at all levels. Strive for a clean and complete message to your audiences.
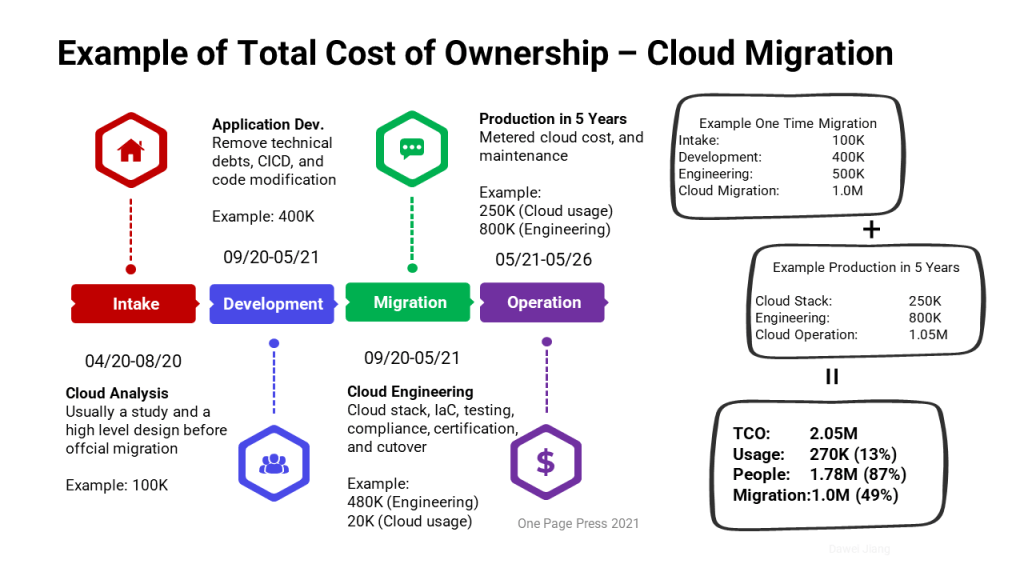
This is an example of total cost of ownership (TCO) from a cloud migration. The total cost is calculated for a five year operation ownership after a full year of migration effort. It is made up of four major areas:
Intake: For organizations that are early in cloud computing, a research and planning phase is very common. This includes formal cloud readiness analysis, tools and services acquisition, a process that prioritize the order of system migration. It varies from consulting only to prototype and pilots. The careful one usually complete a full cost study. Intake is carried out by internal team or special external team.
Development: Most legacy application requires some degree of technical debts removal before it is cloud ready. Common activities such as API enablement (remove tight coupled direct database calls), containerization, upgrade frameworks, upgrading platform, adopt DevSecOps automation, such as CICD pipeline, and other development efforts. This work is a natural improvement of any legacy system, and worth to consider. I consider this a major benefit of any cloud migration: pouring the new wine in the new wine skin.
Migration: This can be done either through a lift-and-shift migration, or a re-platform, where we adopt cloud native technology stack. Cloud engineers are the main force to drive this phase. It spans from weeks to months, and usually have minimum to maximum constraints tied to the existing overall infrastructure. Please remember, dual environments will co-exist throughout this period, that you are likely having two parallel lower environments (one or more) and two parallel production ones. Consider also data migration, code freeze, and coordinated cutover.
Operation: This phase starts from live cloud launch and later decommissioning the old stack. It also means continue improving the new stack. It is likely the migration phase generated a backlog of pending engineering work. And optimizations on cost, performance, and automation are always part of DevSecOps. In addition, there will be application customization requirement in the future years. In my example, I keep a full stack engineer throughout the operation period to cover not only engineer work, but also potential system maintenance and enhancement.
Total Cost of Ownership Example
What does the simple example of TCO tells us? People cost is and will continue be your top IT cost. Therefore, besides invest on the tools and technologies, invest on people; when transform technologies, transform the skillsets and the culture first.
I’ve seen examples where a cloud enabled development team build in cloud migration as part of normal development task, and significantly bring down the cost by not having a special migration task force. However, this does not come free and requires early investment, training, and leadership support.
Cost saving, cost clarity, and cost opportunities are among the best offers cloud computing provide. Cloud makes cost saving not only possible, but quantitatively measurable.