From system migration to service adoption, cloud progress is about excellence on both business applications and maturity of infrastructure. A balanced approach promotes a healthy growth of the community, and ensure consistent value delivery and lasting benefits to the organization.
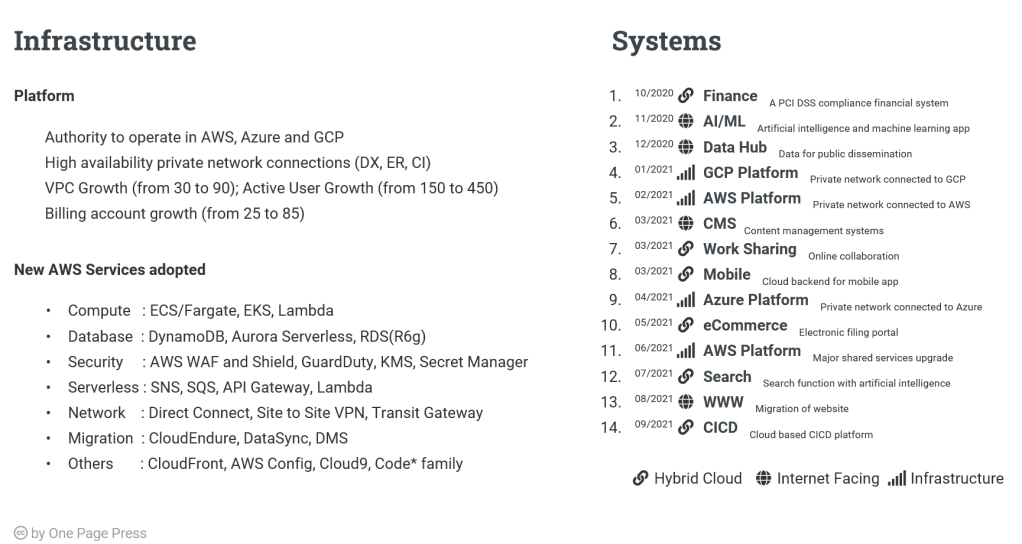
This is an example of a cloud roadmap, or a score card of the past performance year. The blue cloud icons with a up arrow signals a list of successful cloud computing systems, either via migration or native development. The plus icon is next to a list of cloud services (AWS) being adopted. You can see the same list of services with their official mark on the calendar tab. I used a fiscal year timeline, which is from October to September of the following year. Instead of showing you a plain spreadsheet, or a lengthy presentation, this is visually pleasant and information compact.
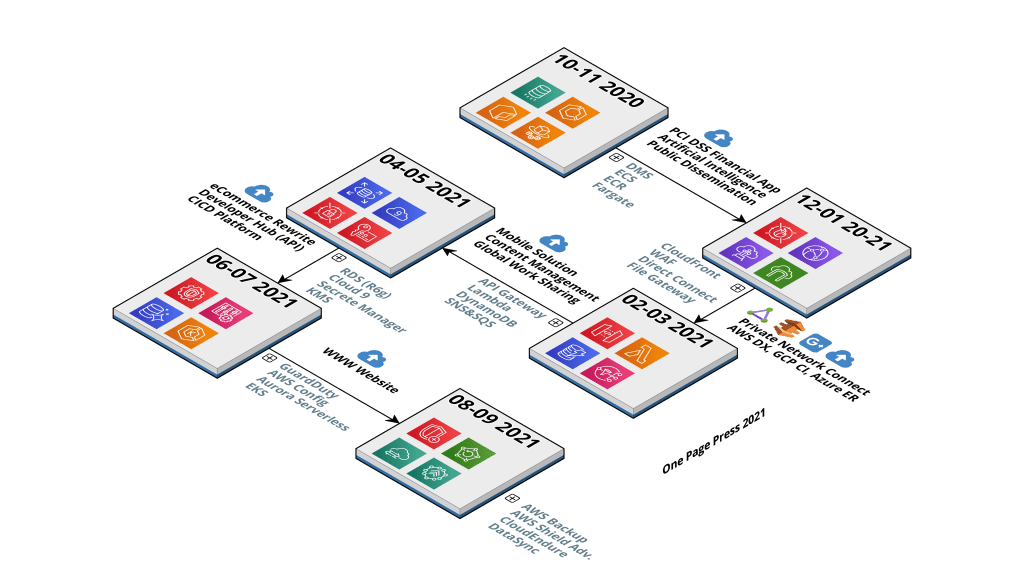
One can create roadmaps in a variety of ways. As the first signature post One Page Press presents, I build a slideshow below to demonstrate along with two other views (summary, time table, and graphics) where the exact same information is displayed.
- Summary style: focus on subjects, numbers, categorization, and calling out key accomplishments.
- Time table style: focus on chronological order of events, with same format of each block, and should be the default view.
- Graphic style: colors, flows, inserts, 3D touch, and much more. In this example, I intentionally omitted summary to leave the picture less busy.


Which flavor do you like? Please like, comment, share and follow. You can email me for other great ideas and thoughts.
